8. Cluster Monitoring And Horizontal Autoscaling
In this lab, we will install and use some common Kubernetes cluster monitoring tools. We will then deploy a Kubernetes Horizontal Pod Autoscaler (HPA) and manage a Deployment replica count using the CPU metric.
| Chapter Details | |
|---|---|
| Chapter Goal | Learn Kubernetes best practices |
| Chapter Sections | |
8.1. Deploy Core Metrics Server
Make sure that Core Metrics Server is deployed:
$ kubectl apply -f ~/k8s-examples/extensions/metrics-server
clusterrolebinding.rbac.authorization.k8s.io/metrics-server:system:auth-delegator unchanged
rolebinding.rbac.authorization.k8s.io/metrics-server-auth-reader unchanged
apiservice.apiregistration.k8s.io/v1beta1.metrics.k8s.io unchanged
serviceaccount/metrics-server unchanged
deployment.extensions/metrics-server unchanged
service/metrics-server unchanged
clusterrole.rbac.authorization.k8s.io/system:metrics-server unchanged
clusterrolebinding.rbac.authorization.k8s.io/system:metrics-server unchanged
If the Metrics Server is already deployed you will get some warnings, which are harmless.
8.2. Install kube-prometheus
Kube-prometheus is a collection of manifests that combines various monitoring tools such as Prometheus, Grafana, Alertmanager, and etc. It is preconfigured to collect metrics from all Kubernetes components and provide you with a default set of dashboard and alerting rules.
The source code and manifests are available at ~/k8s-examples/addons/kube-prometheus
We will use these manifests to deploy all of our monitoring components. We will need to stage our deployment to mitigate any race conditions as Kube-prometheus includes Custom Resource Definitions and a custom operator.
Step 1 Install the custom kube-prometheus operator components by applying the manifests:
$ kubectl apply -f ~/k8s-examples/addons/kube-prometheus/manifests/setup
namespace/monitoring created
customresourcedefinition.apiextensions.k8s.io/alertmanagers.monitoring.coreos.com created
customresourcedefinition.apiextensions.k8s.io/podmonitors.monitoring.coreos.com created
customresourcedefinition.apiextensions.k8s.io/prometheuses.monitoring.coreos.com created
customresourcedefinition.apiextensions.k8s.io/prometheusrules.monitoring.coreos.com created
customresourcedefinition.apiextensions.k8s.io/servicemonitors.monitoring.coreos.com created
customresourcedefinition.apiextensions.k8s.io/thanosrulers.monitoring.coreos.com created
clusterrole.rbac.authorization.k8s.io/prometheus-operator created
clusterrolebinding.rbac.authorization.k8s.io/prometheus-operator created
deployment.apps/prometheus-operator created
service/prometheus-operator created
serviceaccount/prometheus-operator created
Step 2 Wait a minute for Promethus operator components to become ready. Confirm the status:
$ kubectl get all -n monitoring
NAME                                       READY   STATUS    RESTARTS   AGE
pod/prometheus-operator-6694b5cb64-8jnhq   2/2     Running   0          21s

NAME                          TYPE        CLUSTER-IP   EXTERNAL-IP   PORT(S)    AGE
service/prometheus-operator   ClusterIP   None         <none>        8443/TCP   22s

NAME                                  READY   UP-TO-DATE   AVAILABLE   AGE
deployment.apps/prometheus-operator   1/1     1            1           22s

NAME                                             DESIRED   CURRENT   READY   AGE
replicaset.apps/prometheus-operator-6694b5cb64   1         1         1       22s
Step 3 Deploy the remaining Kube-Prometheus components to the cluster:
$ kubectl apply -f ~/k8s-examples/addons/kube-prometheus/manifests
alertmanager.monitoring.coreos.com/main created
secret/alertmanager-main created
service/alertmanager-main created
serviceaccount/alertmanager-main created
servicemonitor.monitoring.coreos.com/alertmanager created
secret/grafana-datasources created
configmap/grafana-dashboard-apiserver created
configmap/grafana-dashboard-cluster-total created
configmap/grafana-dashboard-controller-manager created
configmap/grafana-dashboard-k8s-resources-cluster created
...
Step 4 Wait a few minutes for the monitoring workload to startup. Get all resources in the monitoring namespace to see its progress:
$ kubectl get all -n monitoring
NAME                                       READY   STATUS    RESTARTS   AGE
pod/alertmanager-main-0                    2/2     Running   0          16m
pod/alertmanager-main-1                    2/2     Running   0          15m
pod/alertmanager-main-2                    2/2     Running   0          15m
pod/grafana-545d8c5576-k8mt2               1/1     Running   0          16m
pod/kube-state-metrics-6898cf84bd-mhlkc    4/4     Running   0          16m
pod/node-exporter-278tq                    2/2     Running   0          16m
pod/node-exporter-2tdh5                    2/2     Running   0          16m
pod/node-exporter-562lp                    2/2     Running   0          16m
pod/prometheus-adapter-66fc7797fd-mc6pk    1/1     Running   0          16m
pod/prometheus-k8s-0                       3/3     Running   1          15m
pod/prometheus-k8s-1                       3/3     Running   1          15m
pod/prometheus-operator-6f96f6d567-lnzlh   1/1     Running   0          16m

NAME                            TYPE        CLUSTER-IP       EXTERNAL-IP   PORT(S)             AGE
service/alertmanager-main       ClusterIP   10.100.248.138   <none>        9093/TCP            16m
service/alertmanager-operated   ClusterIP   None             <none>        9093/TCP,6783/TCP   16m
service/grafana                 NodePort    10.107.108.8     <none>        3000:32617/TCP      16m
service/kube-state-metrics      ClusterIP   None             <none>        8443/TCP,9443/TCP   16m
service/node-exporter           ClusterIP   None             <none>        9100/TCP            16m
service/prometheus-adapter      ClusterIP   10.106.31.232    <none>        443/TCP             16m
service/prometheus-k8s          ClusterIP   10.108.119.164   <none>        9090/TCP            16m
service/prometheus-operated     ClusterIP   None             <none>        9090/TCP            15m
service/prometheus-operator     ClusterIP   None             <none>        8080/TCP            16m

NAME                           DESIRED   CURRENT   READY   UP-TO-DATE   AVAILABLE   NODE SELECTOR                 AGE
daemonset.apps/node-exporter   3         3         3       3            3           kubernetes.io/os=linux        16m

NAME                                  READY   UP-TO-DATE   AVAILABLE   AGE
deployment.apps/grafana               1/1     1            1           16m
deployment.apps/kube-state-metrics    1/1     1            1           16m
deployment.apps/prometheus-adapter    1/1     1            1           16m
deployment.apps/prometheus-operator   1/1     1            1           16m

NAME                                             DESIRED   CURRENT   READY   AGE
replicaset.apps/grafana-545d8c5576               1         1         1       16m
replicaset.apps/kube-state-metrics-6898cf84bd    1         1         1       16m
replicaset.apps/prometheus-adapter-66fc7797fd    1         1         1       16m
replicaset.apps/prometheus-operator-6f96f6d567   1         1         1       16m

NAME                                 READY   AGE
statefulset.apps/alertmanager-main   3/3     16m
statefulset.apps/prometheus-k8s      2/2     15m
As you can see, this is a comprehensive deployment of many services that provide you cluster monitoring.
8.3. Access Grafana Dashboard
Grafana dashboard has already been installed as defined in one of the manifests files from the previous section. Let’s obtain its endpoint and take a look in our browser.
Step 1 Obtain the Grafana service NodePort:
$ kubectl get svc -n monitoring grafana
NAME      TYPE       CLUSTER-IP     EXTERNAL-IP   PORT(S)          AGE
grafana   NodePort   10.107.108.8   <none>        3000:32617/TCP   33m
The node port in this example is 32617, but yours may be different.
Step 2 In your browser, open the following URL (replace <nodePort> with the nodePort number from the previous step):
http://<lab-ip>:<nodePort>
Step 4 Log-in with admin user and admin password:

You will be prompted to change your password. You can skip this step since this is a lab environment:

Step 5 Click on the Home Drop-down menu, Default, then click Kubernetes / Compute Resources / Cluster:
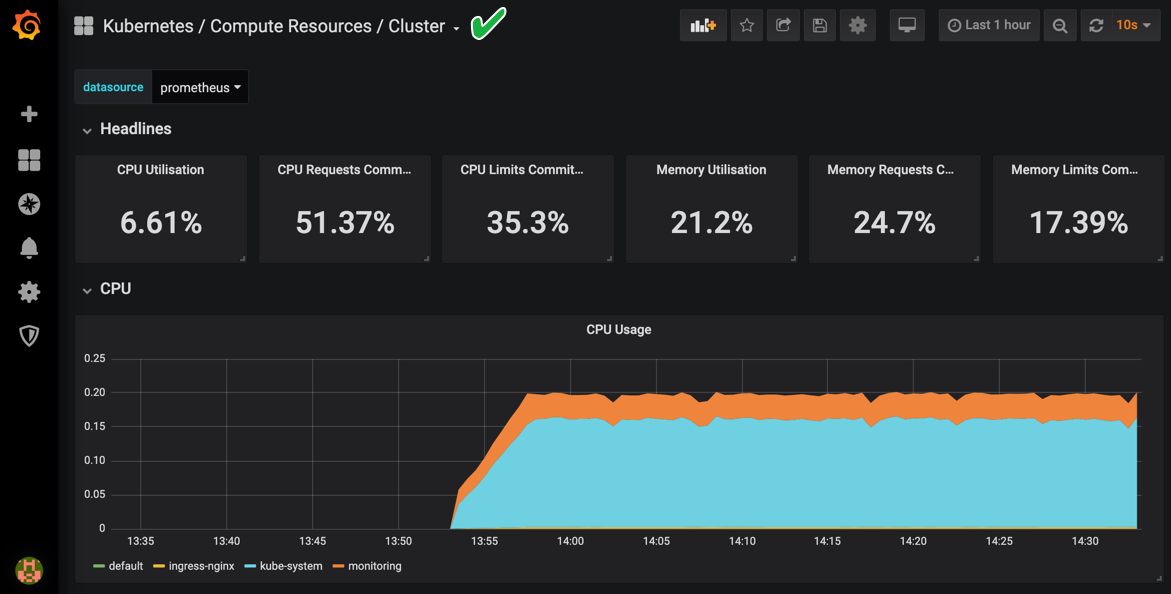
This shows you a great overview of your cluster health. Feel free to explore other dashboards configured in Grafana. Proceed when you are ready. Note that it will take a few minutes for your datapoints to be populated similar to the screenshot shown.
8.4. Auto-Scaling
Horizontal Pod Autoscaler automatically scales the number of pods in a replication controller, deployment or replica set based on observed CPU utilization. The Horizontal Pod Autoscaler will use the metrics-server already deployed in your cluster to collect metrics.
8.4.1. Create an Application
To demonstrate scaling by the Horizontal Pod Autoscaler (HPA), we will use a custom docker image based on the php-apache image. It contains index.php page, which performs some CPU intensive computations.
Step 1 Run the application and expose its port:
$ kubectl run php-apache --image=gcr.io/google_containers/hpa-example --requests=cpu=200m \
--expose --port=80

service/php-apache created
deployment.apps/php-apache created
Step 2 Check that the application’s pod is running:
$ kubectl get pods -l run=php-apache
NAME                          READY   STATUS    RESTARTS   AGE
php-apache-864967cc4f-gr7hs   1/1     Running   0          4m6s
Step 3 Check that the application responds on the service clusterIP address and port 80:
$ curl http://$(kubectl get svc php-apache -o jsonpath={..clusterIP}):80
OK!
8.4.2. Create a Horizontal Pod Autoscaler
Step 1 Use the following command to create a Horizontal Pod Autoscaler that maintains between 1 and 10 replicas of the Pods controlled by the php-apache deployment we created in the previous steps:
$ kubectl autoscale deployment php-apache --cpu-percent=50 --min=1 --max=10
horizontalpodautoscaler.autoscaling/php-apache autoscaled
With this command, we specify that we want the HPA to create addtional replicas (up to 10) when CPU pressure reaches and remains over 50%.
Step 2 Check the current status of autoscaler:
$ kubectl get hpa
NAME         REFERENCE               TARGETS    MINPODS   MAXPODS   REPLICAS
php-apache   Deployment/php-apache   0% / 50%   1         10        1
Note that the current CPU consumption is 0% as we are not sending any requests to the server. If you see <unknown> instead of 0% wait a few minutes and run the command again: the autoscaler needs some time to gather information for the application.
8.4.3. Increase load
We will start a container, and send an infinite loop of queries to the php-apache service (remember, that our page in the php-apache application consumes a lot of CPU resources for each request).
Step 1 Open a new terminal and log in to the lab again (you also can use tmux or screen to open a new window in the same SSH session). In a new terminal, run the following command:
$ kubectl run -i --tty load-generator --image=busybox /bin/sh
If you don't see a command prompt, try pressing enter.
/ #
Step 2 In the load-generator container run the following infinite loop to generate a load for our application:
/ # while true; do wget -q -O- http://php-apache.default.svc.cluster.local; done
OK!OK!..
Keep the command running and wait a few minutes.
Step 3 In the first terminal, check the current status of autoscaler:
$ kubectl get hpa
NAME         REFERENCE               TARGETS      MINPODS   MAXPODS   REPLICAS
php-apache   Deployment/php-apache   122% / 50%   1         10        4
As you see, CPU consumption has increased to 122%. As a result, the deployment was resized to 4 replicas (in you lab, the numbers can be different):
$ kubectl get deployment php-apache
NAME         DESIRED   CURRENT   UP-TO-DATE   AVAILABLE
php-apache   4         4         4            4
8.4.4. Stop Load
Step 1 Return to the second terminal and stop the load generator (press Ctrl-C). Delete the load-generator deployment:
$ kubectl delete deployment load-generator
deployment.extensions "load-generator" deleted
You also can close the second terminal, we do not need it any more.
Step 2 In the first terminal, check the current status of autoscaler:
$ kubectl get hpa -w
NAME         REFERENCE               TARGETS    MINPODS   MAXPODS   REPLICAS   AGE
php-apache   Deployment/php-apache   0% / 50%   1         10        4          6m36s
php-apache   Deployment/php-apache   0% / 50%   1         10        1          11m
Note: The scaling down process can take up to five minutes. If your Replica count has not decreased, wait an aditional minute. When ready, press Ctrl-C to stop watching the status of the HPA.
8.4.5. Delete the Application
Delete the php-apache application and service:
$ kubectl delete service,deployment php-apache
service "php-apache" deleted
deployment.apps "php-apache" deleted
Checkpoint
- Install Kubernetes addon, metrics-server
- Install Kube-Prometheus
- View available Grafana Dashboards
- Use Horizontal Pod Autoscaler to scale the number of pods in a Deployment
![]()
Table Of Contents
- 1. Classroom Environment
- 2. Kubernetes Installation
- 3. Kubernetes Building Blocks
- 4. Containerized Application Development
- 5. Kubernetes Addons
- 6. Kubernetes Best Practices
- 7. Kubernetes Architecture
- 8. Cluster Monitoring And Horizontal Autoscaling
- 9. Kubernetes Security
- 10. Cluster Management
- 11. Comprehensive Practice