11. Cluster Monitoring And Horizontal Autoscaling
In this lab, we will install and use some common Kubernetes cluster monitoring tools. We will then deploy a Kubernetes Horizontal Pod Autoscaler (HPA) and manage a Deployment replica count using the CPU metric.
| Chapter Details | |
|---|---|
| Chapter Goal | Learn Kubernetes best practices |
| Chapter Sections | |
11.1. Deploy Core Metrics Server
Make sure that Core Metrics Server is deployed:
$ kubectl apply -f ~/k8s-examples/extensions/metrics-server-1.8+
clusterrolebinding "metrics-server:system:auth-delegator" created
rolebinding "metrics-server-auth-reader" created
apiservice "v1beta1.metrics.k8s.io" created
serviceaccount "metrics-server" created
deployment "metrics-server" created
service "metrics-server" created
clusterrole "system:metrics-server" created
clusterrolebinding "system:metrics-server" created
If the Metrics Server is already deployed you will get some warnings, which are harmless.
11.2. Install InfluxDB
Install InfluxDB (storage backend for Heapster):
$ kubectl apply -f ~/k8s-examples/addons/heapster/influxdb.yaml
deployment "monitoring-influxdb" created
service "monitoring-influxdb" created
11.3. Install Heapster
When our Kubernetes cluster is configured with RBAC, we must authorize Heapster. It’s best to do this first to get clean logs from Heapster:
$ kubectl apply -f ~/k8s-examples/addons/heapster/heapster-rbac.yaml
clusterrolebinding "heapster" created
Install Heapster:
$ kubectl apply -f ~/k8s-examples/addons/heapster/heapster.yaml
serviceaccount "heapster" created
deployment "heapster" created
service "heapster" created
Check that the Heapster pod is running:
$ kubectl get pods -n kube-system | grep heapster
heapster-...     1/1       Running   0          1m
11.4. Install Grafana
Heapster with InfluxDB enable us to collect metrics. In this section, we will install Grafana, data visualization and monitoring platform.
Step 1 Create a Grafana deployment and service:
$ kubectl apply -f ~/k8s-examples/addons/heapster/grafana.yaml
deployment "monitoring-grafana" created
service "monitoring-grafana" created
Step 2 Get the port number for the monitoring-grafana service:
$ kubectl get svc monitoring-grafana -n kube-system
NAME                 CLUSTER-IP      EXTERNAL-IP   PORT(S)
monitoring-grafana   <cluster-ip>    <nodes>       80:<port>/TCP
Step 3 In your browser, open the following URL (replace <port> with the port number from the previous step):
http://<lab-ip>:<port>
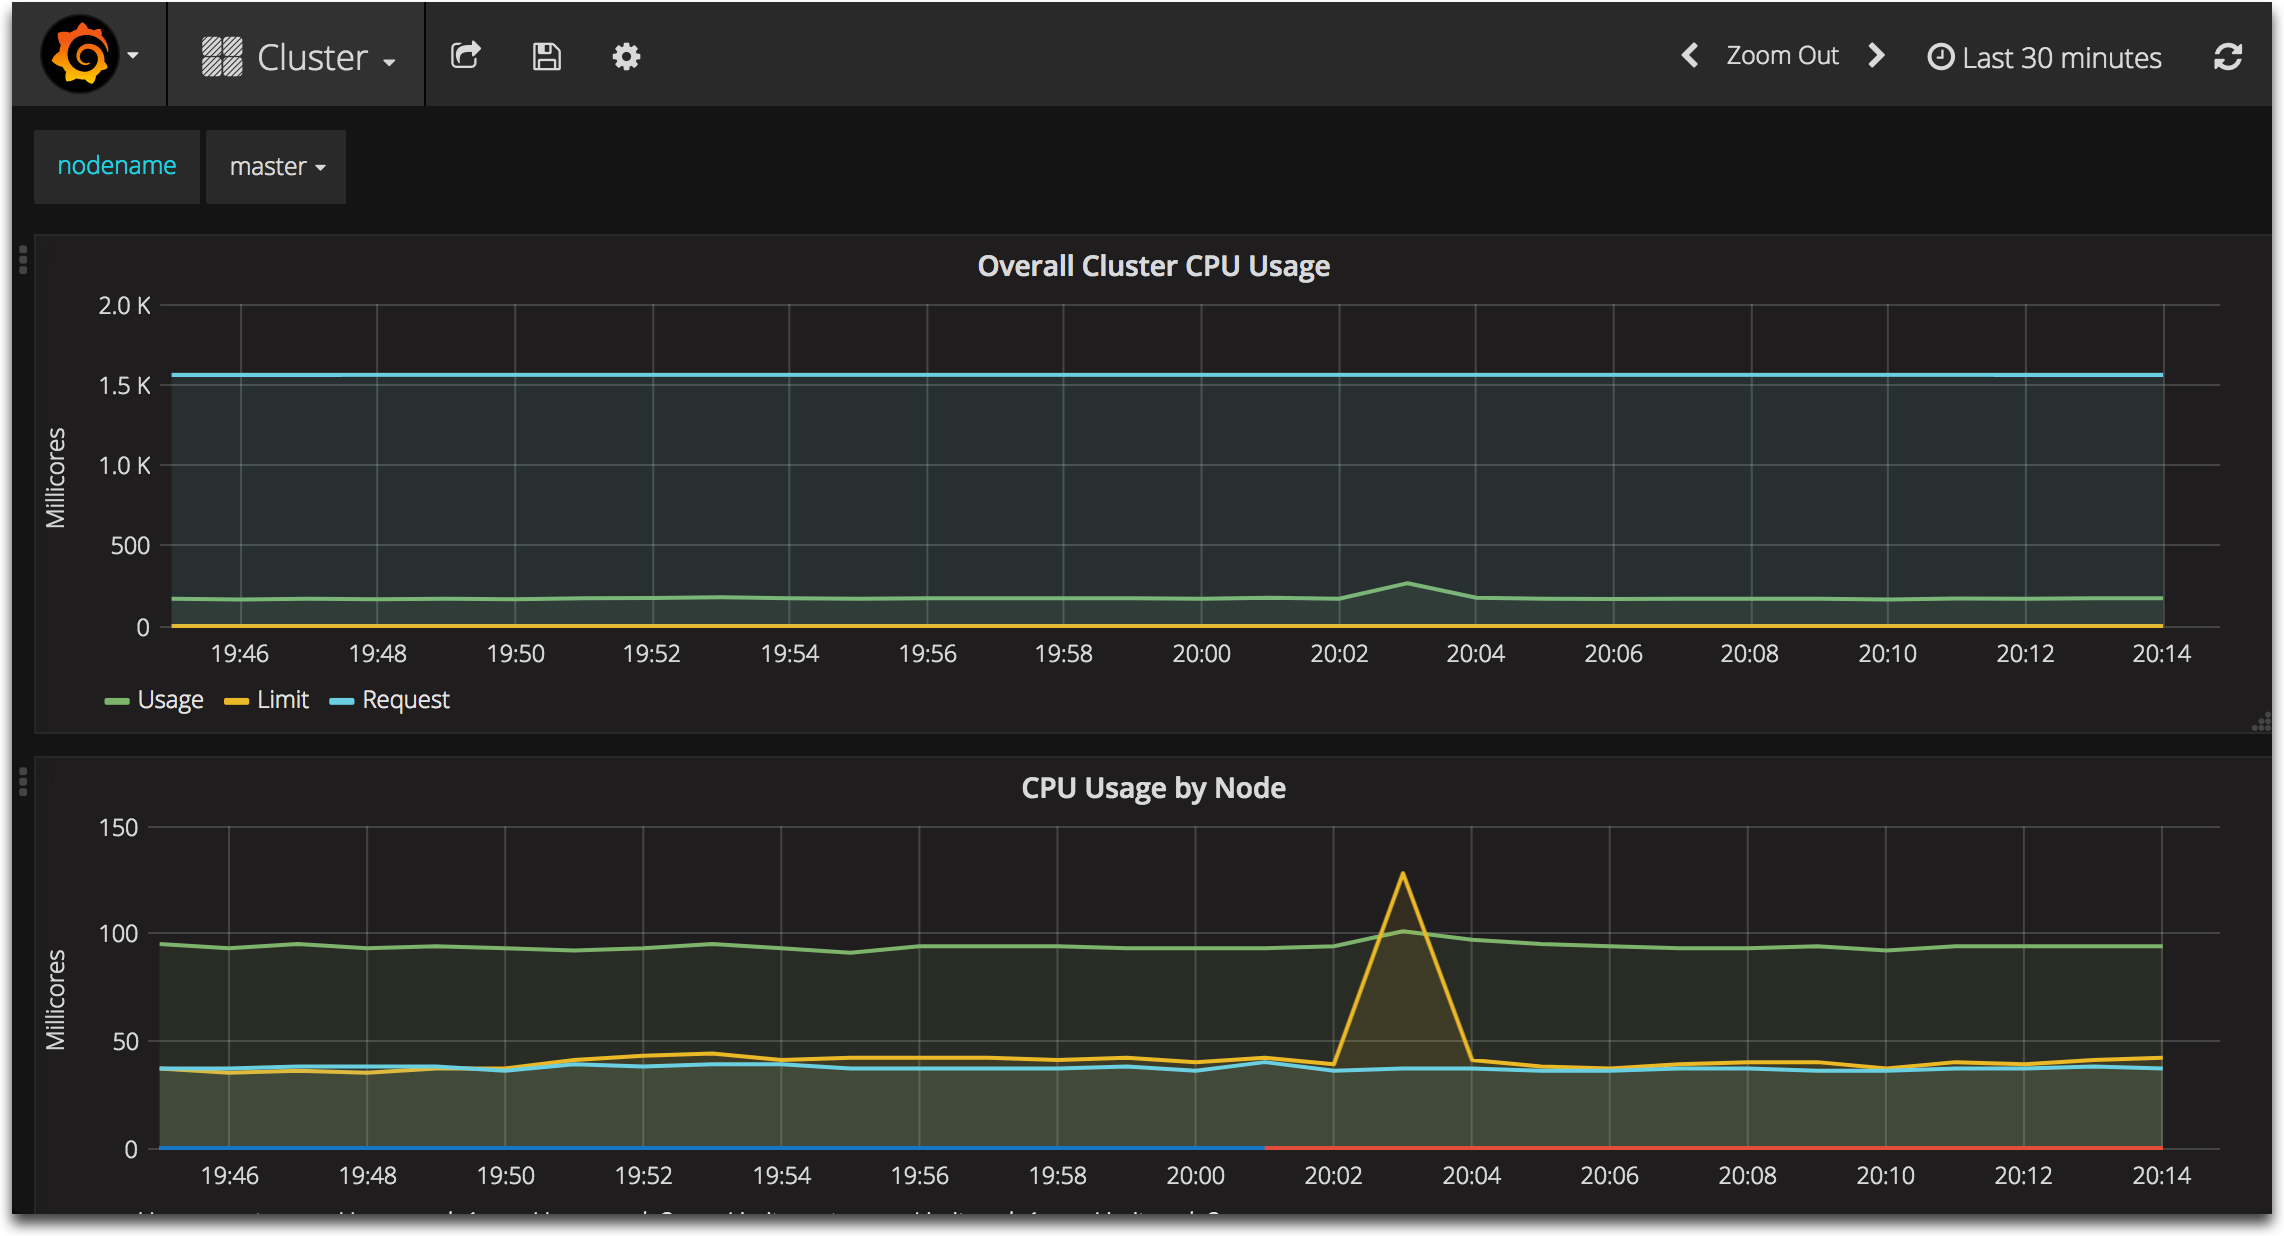
Step 4 In the top menu, choose Cluster and explore metrics for your cluster:
11.5. Auto-Scaling
Horizontal Pod Autoscaler automatically scales the number of pods in a replication controller, deployment or replica set based on observed CPU utilization. Heapster (https://github.com/kubernetes/heapster) needs to be deployed in the cluster as Horizontal Pod Autoscaler uses it to collect metrics.
11.5.1. Create an Application
To demonstrate Horizontal Pod Autoscaler we will use a custom docker image based on the php-apache image. It contains index.php page, which performs some CPU intensive computations.
Step 1 Run the application and expose its port:
$ kubectl run php-apache \
--image=gcr.io/google_containers/hpa-example \
--requests=cpu=200m \
--expose --port=80
service "php-apache" created
deployment "php-apache" created
Step 2 Check that the application’s pod is running:
$ kubectl get pods -l run=php-apache
php-apache-...   1/1       Running   0          1m
Step 3 Check that the application responds on the service clusterIP address and port 80:
$ curl http://$(kubectl get svc php-apache -o jsonpath={..clusterIP}):80
OK!
11.5.2. Create a Horizontal Pod Autoscaler
Step 1 Use the following command to create a Horizontal Pod Autoscaler that maintains between 1 and 10 replicas of the Pods controlled by the php-apache deployment we created in the previous steps:
$ kubectl autoscale deployment php-apache --cpu-percent=50 --min=1 --max=10
deployment "php-apache" autoscaled
Step 2 Check the current status of autoscaler:
$ kubectl get hpa
NAME         REFERENCE               TARGETS    MINPODS   MAXPODS   REPLICAS
php-apache   Deployment/php-apache   0% / 50%   1         10        1
Note that the current CPU consumption is 0% as we are not sending any requests to the server. If you see <unknown> instead of 0% wait a few minutes and run the command again: the autoscaler needs some time to gather information for the application.
Note
If the value under TARGETS is not 0% / 50% then apply the fix in ~/k8s-examples/addons/heapster/fix/README.md/.
11.5.3. Increase load
We will start a container, and send an infinite loop of queries to the php-apache service (remebmer, that our page in the php-apache application consumes a lot of CPU resources for each request).
Step 1 Open a new terminal and log in to the lab again (you also can use tmux or screen to open a new window in the same SSH session). In a new terminal, run the following command:
$ kubectl run -i --tty load-generator --image=busybox /bin/sh
If you don't see a command prompt, try pressing enter.
/ #
Step 2 In the load-generator container run the following infinite loop to generate a load for our application:
/ # while true; do wget -q -O- http://php-apache.default.svc.cluster.local; done
OK!OK!..
Keep the command running and wait a few minutes.
Step 3 In the first terminal, check the current status of autoscaler:
$ kubectl get hpa
NAME         REFERENCE               TARGETS      MINPODS   MAXPODS   REPLICAS
php-apache   Deployment/php-apache   122% / 50%   1         10        4
As you see, CPU consumption has increased to 122%. As a result, the deployment was resized to 4 replicas (in you lab, the numbers can be different):
$ kubectl get deployment php-apache
NAME         DESIRED   CURRENT   UP-TO-DATE   AVAILABLE
php-apache   4         4         4            4
11.5.4. Stop Load
Step 1 Return to the second terminal and stop the load generator (press Ctrl-C). Delete the load-generator deployment:
$ kubectl delete deployment load-generator
deployment "load-generator" deleted
You also can close the second terminal, we do not need it any more. Wait a few minutes.
Step 2 In the first terminal, check the current status of autoscaler:
$ kubectl get hpa
NAME         REFERENCE               TARGETS    MINPODS   MAXPODS   REPLICAS
php-apache   Deployment/php-apache   0% / 50%   1         10        1
11.5.5. Delete the Application
Delete the php-apache application and service:
$ kubectl delete service php-apache
service "php-apache" deleted

$ kubectl delete deployment php-apache
deployment "php-apache" deleted
Checkpoint
- Install InfluxDB
- Install Heapster
- Use Horizontal Pod Autoscaler to scales the number of pods in a replication controller
![]()
Table Of Contents
- 1. Classroom Environment
- 2. Docker Concepts
- 3. Docker Images
- 4. Docker Overlay2 Storage Driver
- 5. Kubernetes Installation
- 6. Kubernetes Building Blocks
- 7. Containerized Application Development
- 8. Kubernetes Addons
- 9. Kubernetes Best Practices
- 10. Kubernetes Architecture
- 11. Cluster Monitoring And Horizontal Autoscaling
- 12. Kubernetes Security
- 13. Cluster Management
- 14. Comprehensive Practice